- DATE:
- AUTHOR:
- The Customer Portal team
New In-Product Analytics for MSPs and in-house teams
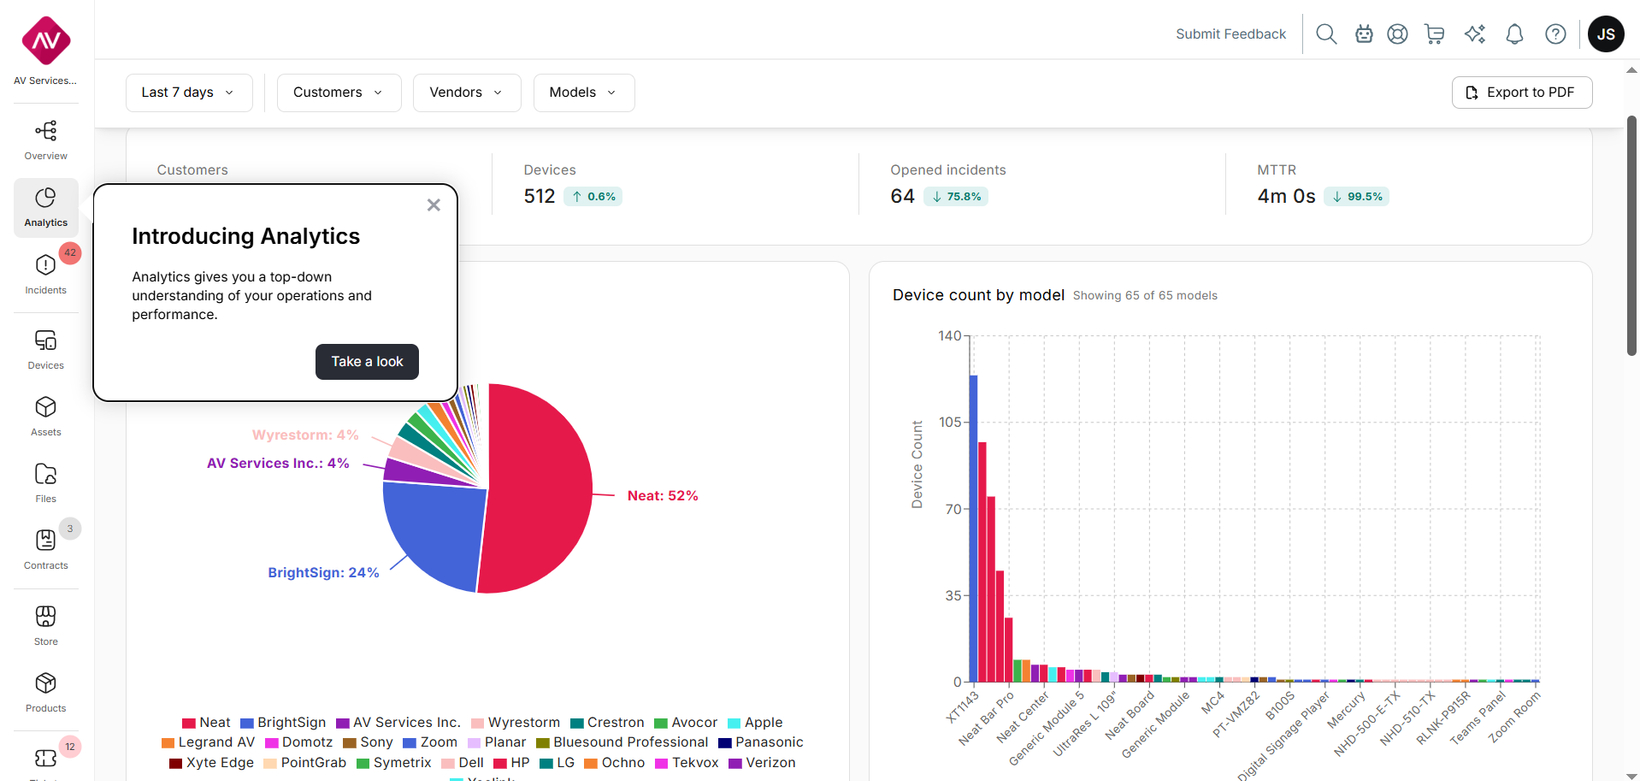
Unlock deeper insights with new in-product analytics on spaces, devices, and device models, which will be available in beta version as of next week. For MSPs managing multiple customers, the analytics dashboard also includes key performance metrics like mean-time-to-resolution and the number of issues resolved before they reach the end-user.
The Analytics tab can be accessed from the left-hand menu, just below the Overview icon. Filter by time range (last 7 days or last 30 days), by customer, by vendor, or by model. All data can be exported to a PDF. Current widgets include device count by vendor, device count by model, devices with and without incidents, and top spaces by incidents.
Planned additions include more flexibility in filters such as custom date ranges, as well as widgets for room utilization, SLA adherence, and downtime reduction, and operational dashboards to help teams proactively identify and resolve issues before they affect end users.
Please contact support@xyte.io with any questions.